


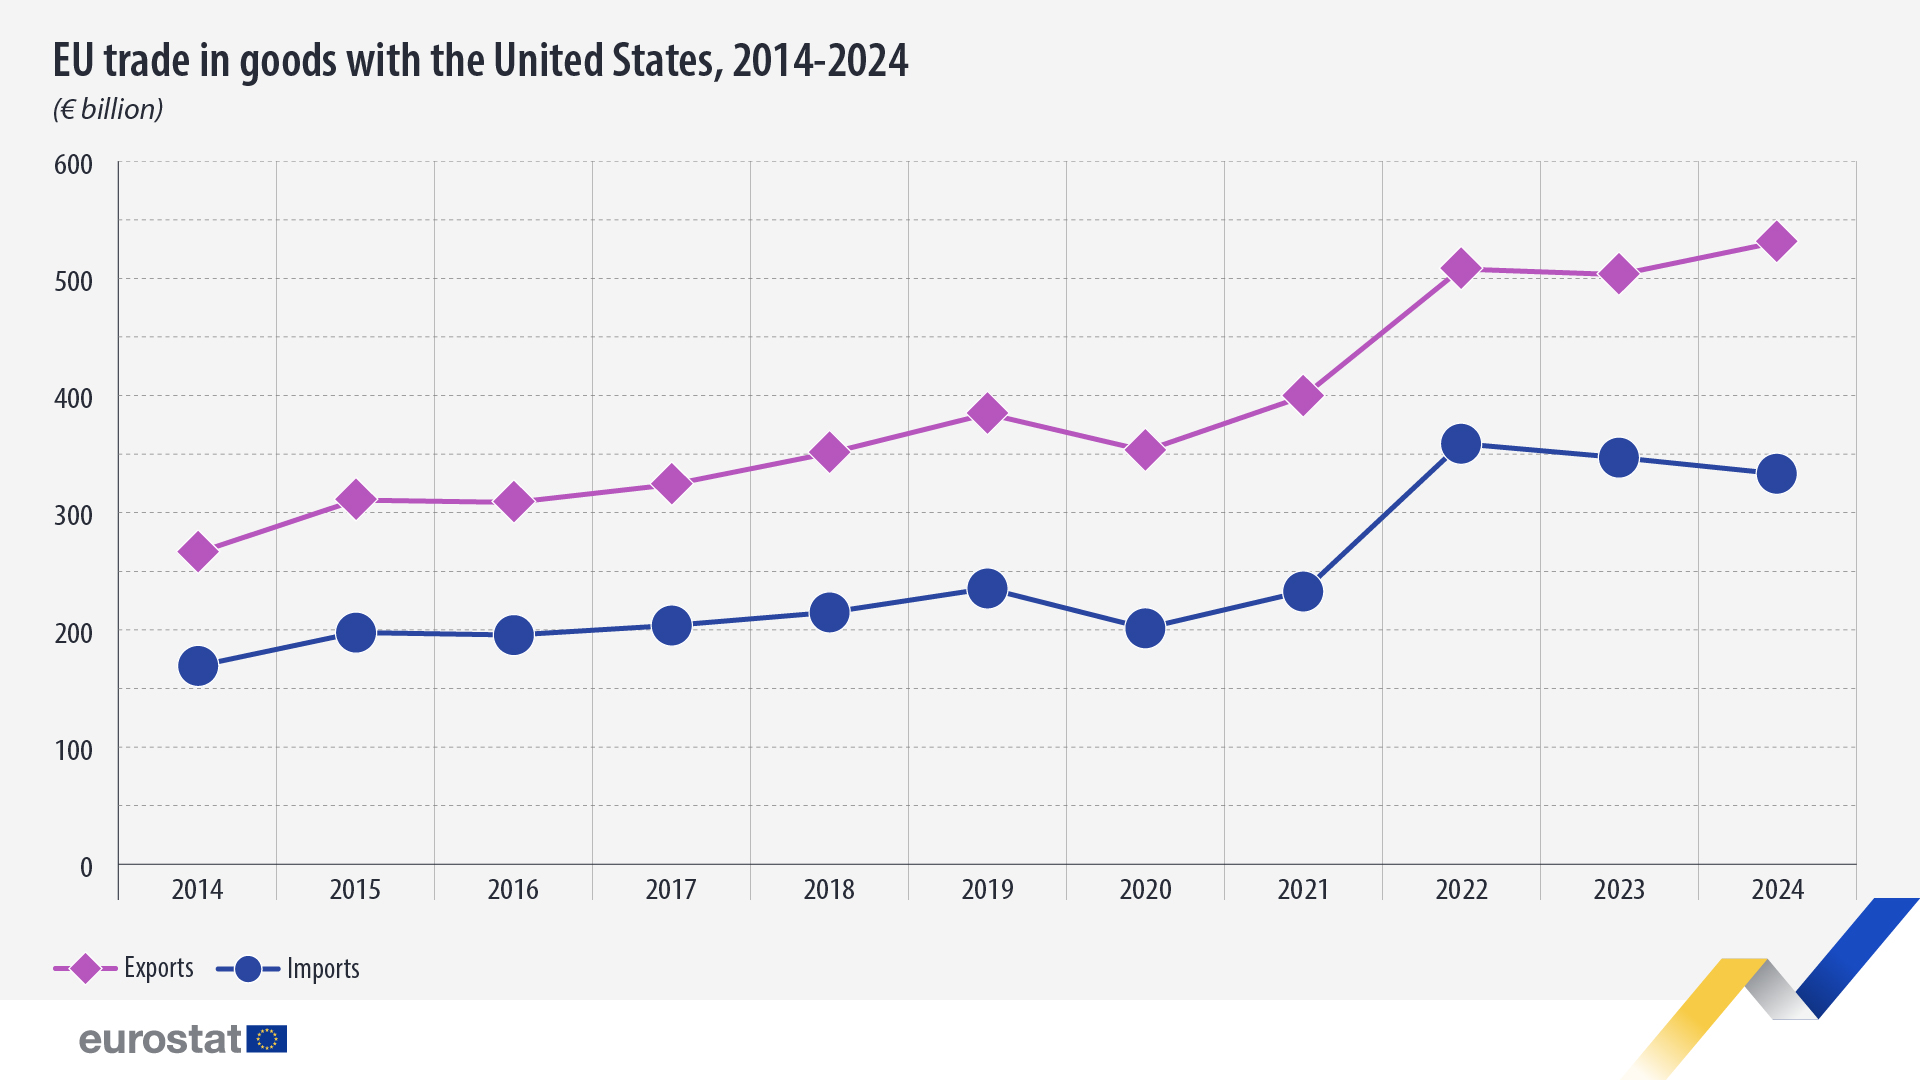
In 2024, the EU exported €531.6 billion in goods to the United States and imported €333.4 billion, resulting in a €198.2 billion trade surplus. Compared with 2023, exports increased by 5.5%, while imports declined by 4.0%.
Source dataset: ds-059331
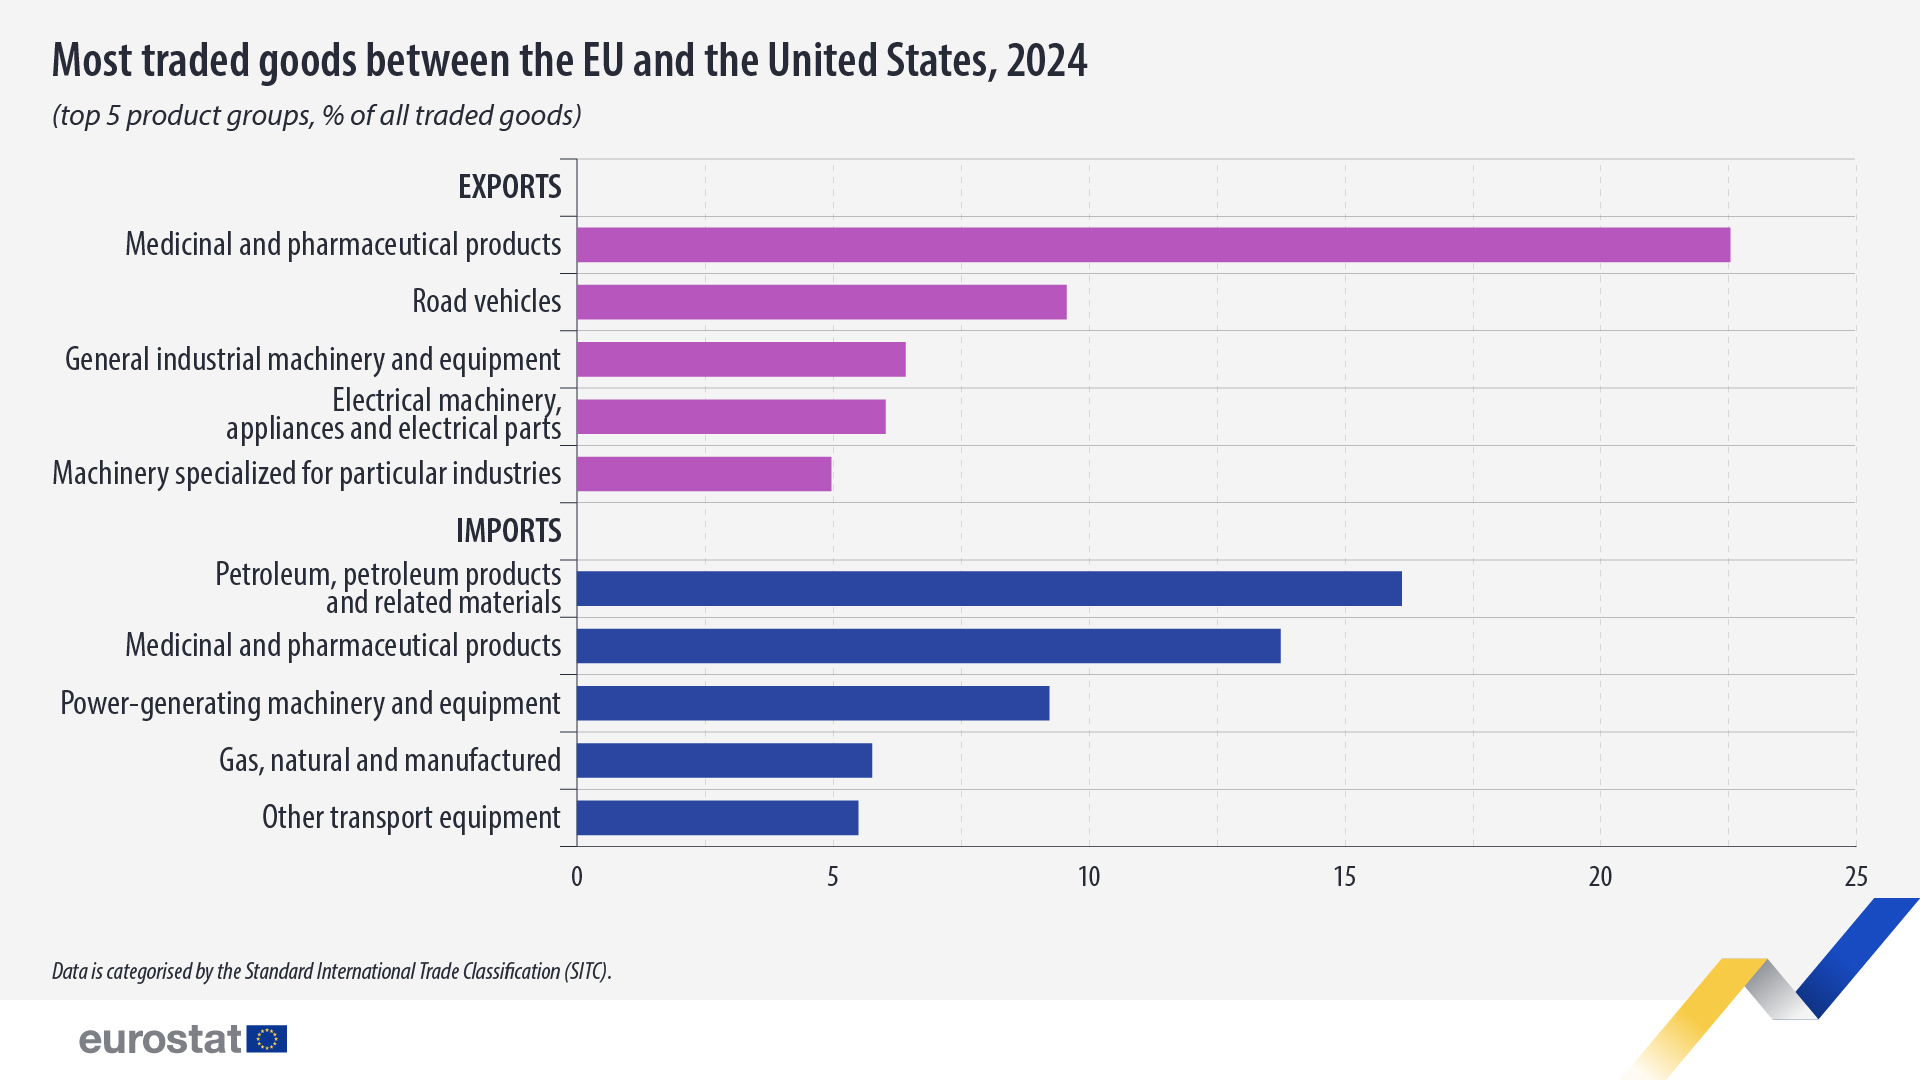
Key goods: medical and pharmaceutical products for exports, petroleum for imports
When looking into the breakdown according to the Standard International Trade Classification (SITC) divisions, the top 5 most exported divisions in 2024 made up half (49.5%) of all exports to the United States. These were medicinal and pharmaceutical products (22.5%), road vehicles (9.6%), general industrial machinery and equipment (6.4%), electrical machinery, appliances and electrical parts (6.0%) and machinery specialized for particular industries (5.0%).
Source dataset: ds-059331
Similarly, for imports, the top 5 divisions accounted for 50.4% of all imported goods. These were petroleum, petroleum products and related materials (16.1%), medicinal and pharmaceutical products (13.8%), power-generating machinery and equipment (9.2%), gas, natural and manufactured (5.8%) and other transport equipment (5.5%).
For more information
Methodological note
Data is categorized according to the Standard International Trade Classification (SITC).
Share this article:
EU Reporter publishes articles from a variety of outside sources which express a wide range of viewpoints. The positions taken in these articles are not necessarily those of EU Reporter.